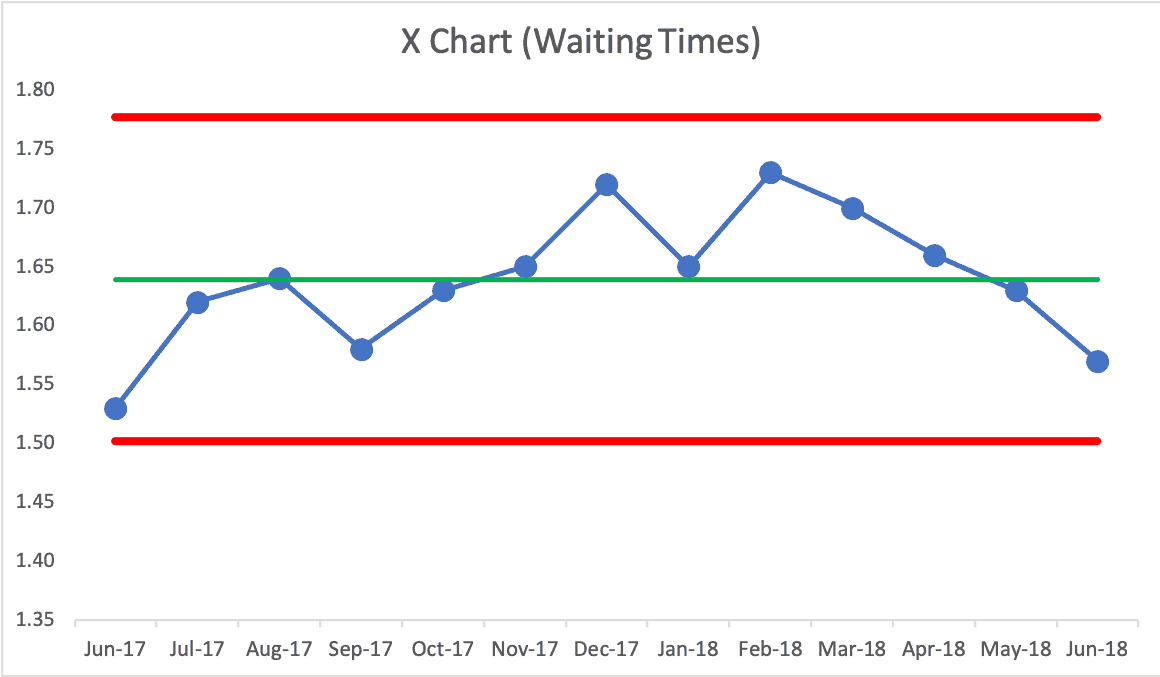
Here is an “X Chart” (part of the Process Behavior Chart methodology) looking at emergency department patient waiting times. See the original blog post.
See the entire blog post at LeanBlog.org:
“ER wait times down, but only slightly” or ER wait times are virtually the same?


If it’s anything like trends in the US, I think it means ER wait times may be down, but it could also be a leveling off and plateau of larger gains that have been achieved over the last handful of years to a decade. Reduced reliance on ER and hospital care has helped save money for a while now, but at some point, we’re going to have to look to other areas to if we want to continue to bend the cost-curve in the right direction.