Process Behavior Chart Template (Excel)
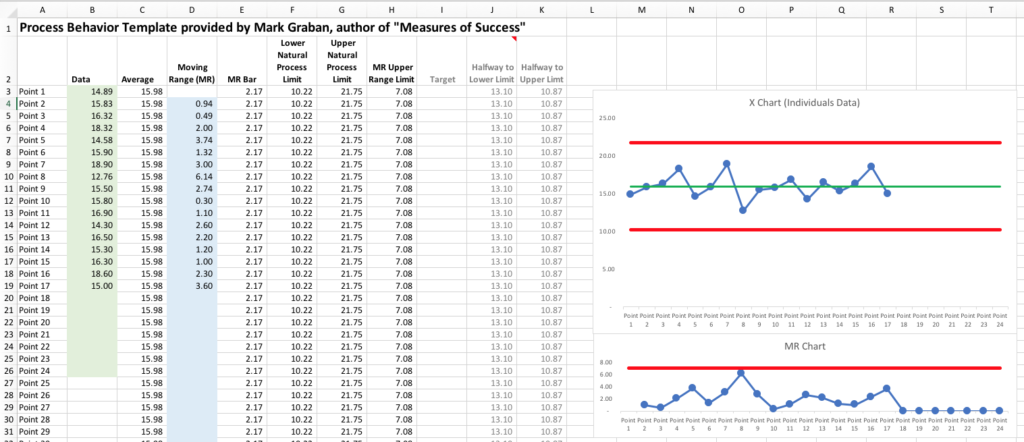
This is a new version as of August 5, 2019 that “freezes” the top row and prevents unnecessary error messages from appearing as green triangles in some cells.
Link to a Google Sheets version of the template
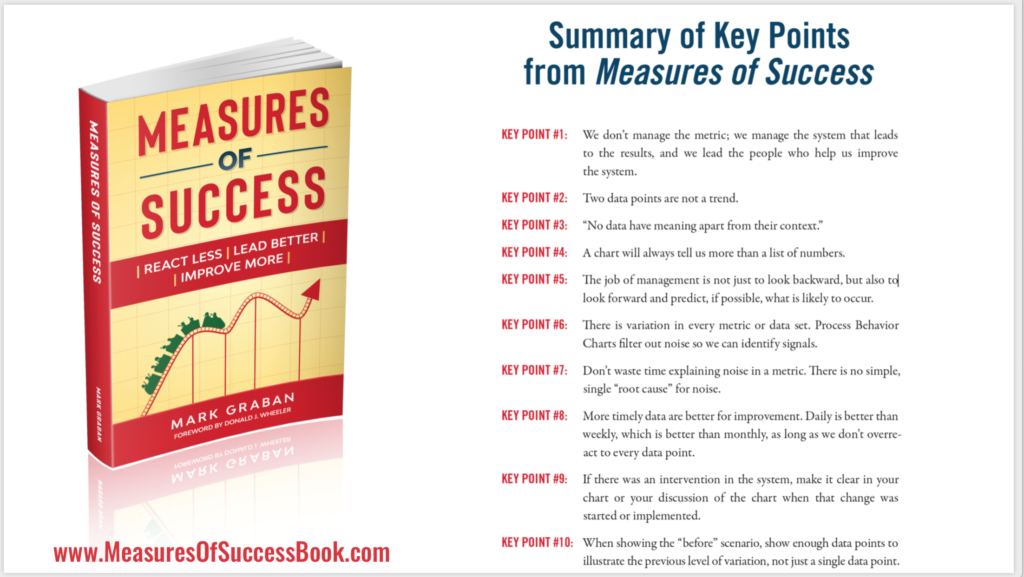
Quick Reference: 10 Key Points
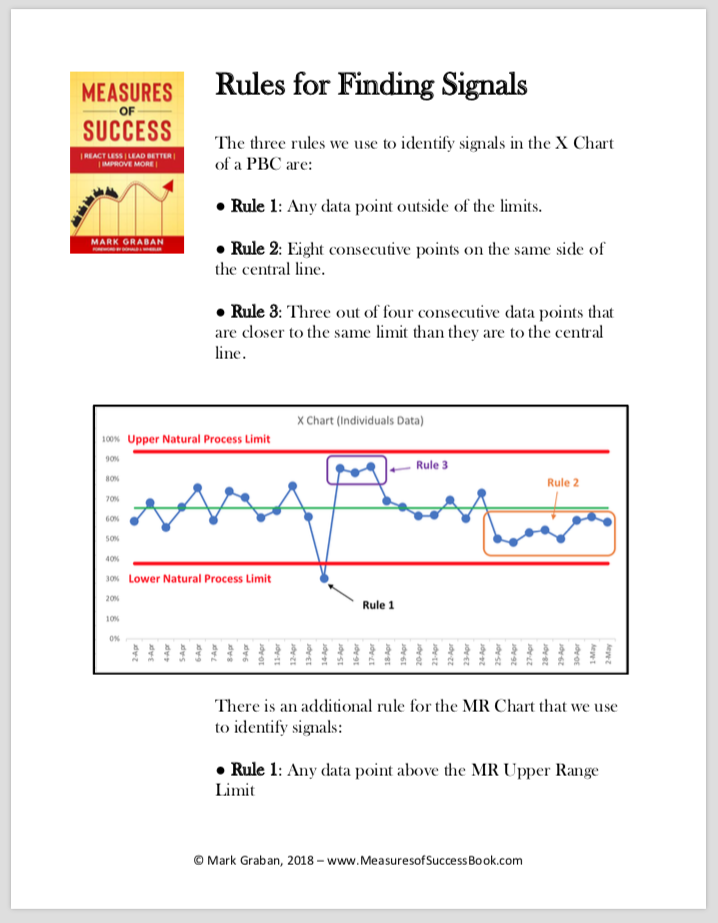
Quick Reference: Rules for Finding Signals