
An interactive workshop for any industry or any size company
Do you feel like you’re chasing your tail – reacting to every up and down in your performance data? Do you get frustrated with being asked to come up with explanations for every “below average” data point or any day that doesn’t hit the target? Are people in your organization wasting time chasing metrics instead of working to systematically improve the system?
If so, I have a workshop for you!
This workshop will show you and your leaders a better way.
We’ll play the “Red Bead Game,” as made famous by the late Dr. W. Edwards Deming. We’ll have fun and learn practical methods and lessons.
In this workshop, you will learn how to:
- Create and interpret “Process Behavior Charts”
- Distinguish between “signal” and “noise” in performance metrics
- Evaluate projects and improvement efforts to look for statistically-meaningful and sustained improvement
- Understand the pitfalls of methods including “red/green” analysis and linear trendlines
- Connect these methods to your Lean Management System
Bring this workshop to your organization.
The past few years, I’ve been conducting a new full-day workshop (built around topics I have taught for more than 20 years)… originally using this title: “Better Metrics: Understanding Variation and Managing Performance Using Deming Methods”
Sometimes we just call it “Measures of Success: React Less, Lead Better, Improve More” like the book.
Past Locations:
- Mark has conducted this workshop for groups and audiences across the United States, as well as countries including Canada, Belgium, The Netherlands, Brazil, and Ireland.
Bring This to Your Location or Event:
- Contact Mark if you’re interested in doing an on-site workshop, or if you’d like to co-organize a public workshop in your area
We Have Options… From One Hour to Two Days:
It’s also possible to do variations on this workshop and its content:
- A one-hour keynote talk
- A two-hour workshop (just the Red Bead Experiment exercise and key lessons from it)
- A four-hour workshop that covers additional topics (without the hands-on chart creation)
- An eight-hour workshop that includes coaching on charts that you’ll create using your own data
- An expanded two-day session that includes topics in Lean Daily Management, Strategy Deployment, and Change Management
The full-day workshop is not a lecture-only session. It’s a hands-on working session that’s customized for your organization. Mark Graban will work with and coach supervisors, managers, directors, VPs, and executives through this unique approach.
We’ll learn… and have fun! It’s an engaging, active workshop that opens attendees’ eyes and gets them thinking.”
“I can’t look at the typical charts and graphs the same way anymore after that workshop!”
Topics on the agenda include:
- Deming’s Red Bead Experiment (Exercise)
- Red Bead Debrief and Lessons for Today
- Why Data Without Context Has No Meaning
- Avoiding Two Data Point Comparisons
- Data Tables vs. Charts
- The Problem with Linear Trend Lines
- Drawing the Right Conclusions from Charts
- How to Create Process Behavior Charts
- How to Properly Interpret Process Behavior Charts
- Connecting Charts to Improvement Activities
- Creating Charts & Discussing Them With Your Own Data (Exercise)
- What to Do Next in Your Organization
Key points include:
- Learning how to separate signal from noise in management / performance data
- Stop reacting to noise by asking for explanations to every up and down in the data
- Working to improve the system to boost performance… which is different than asking “what went wrong yesterday/last week/last month/last quarter?”
- Traditional management methods like threatening punishment, offering rewards, setting targets, doesn’t sustainably improve performance in complex systems
The material in this interactive workshop is built upon classic lessons taught by W. Edwards Deming and Donald J. Wheeler, along with Mark’s own experiences and lessons learned from healthcare organizations, as documented in his book Measures of Success.
“Process Behavior Charts” are Wheeler’s term for what has traditionally been called “Statistical Process Control (SPC) charts” or “control charts.” These charts are incredibly useful for any sort of management metric, whether they’re found on a front-line huddle board or an executive’s strategy deployment wall.
Feedback!
Feedback from the 2017 Lean Healthcare Transformation Summit (click for a larger view):
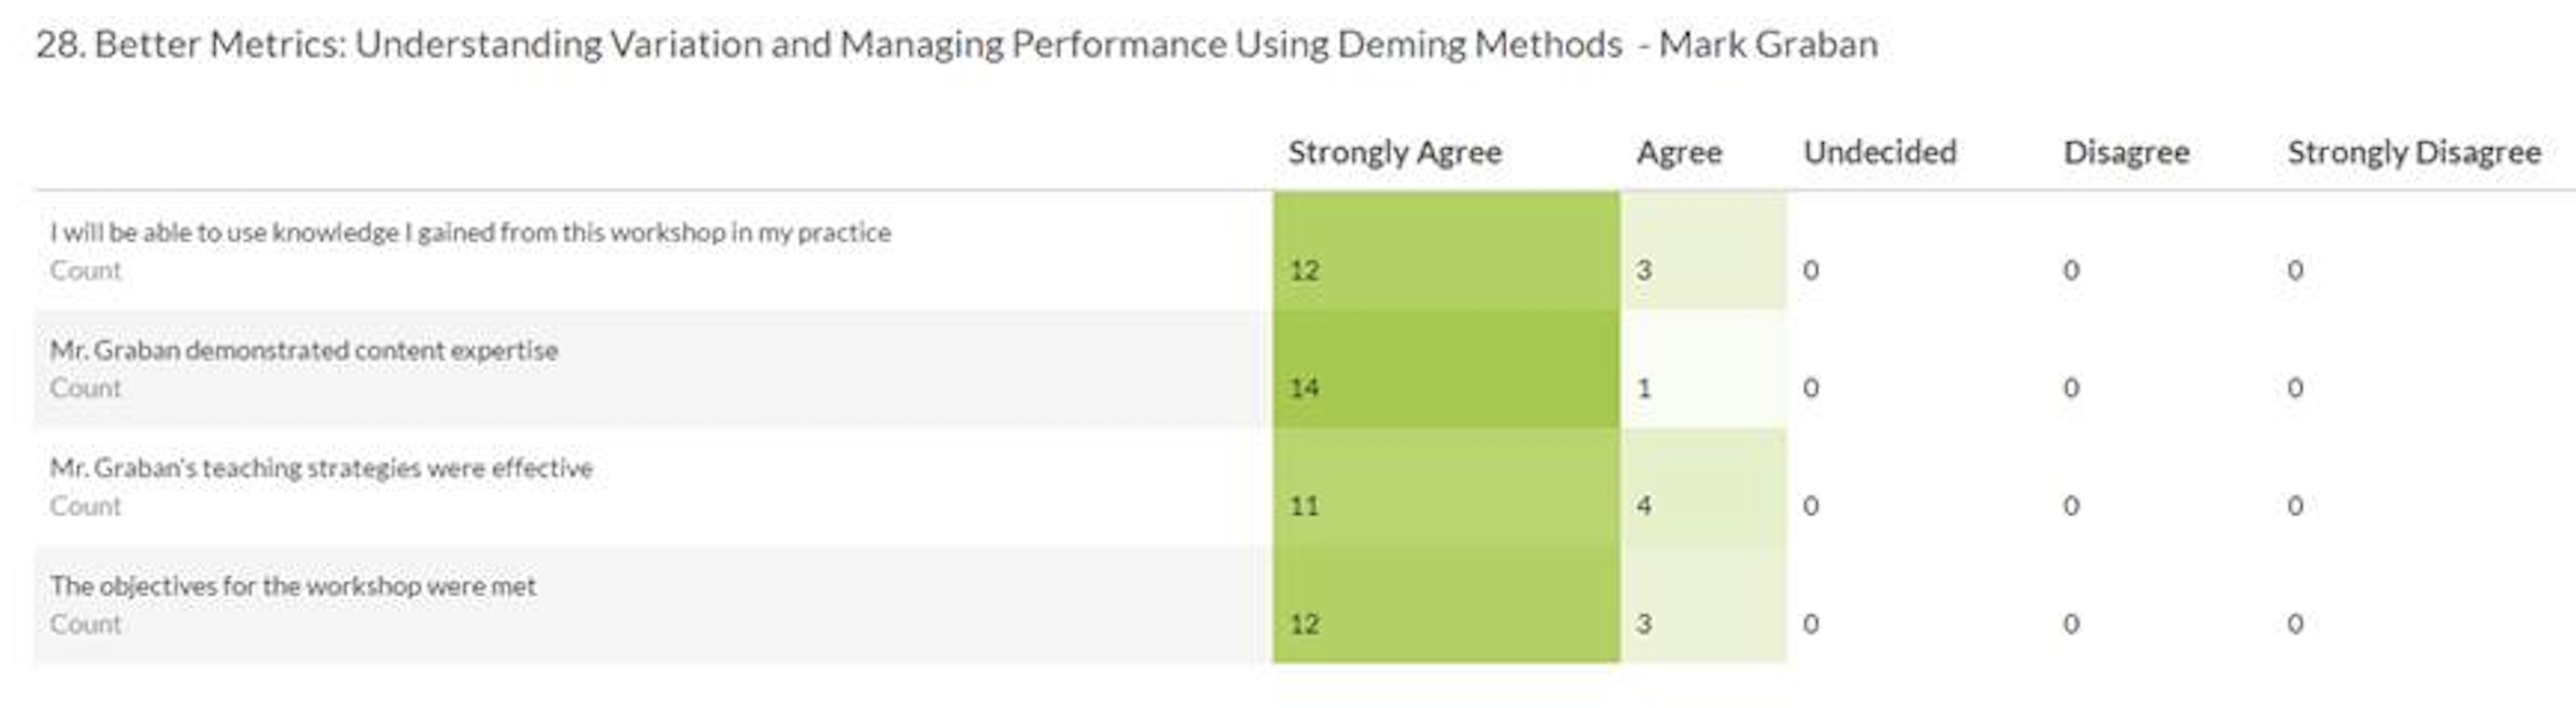
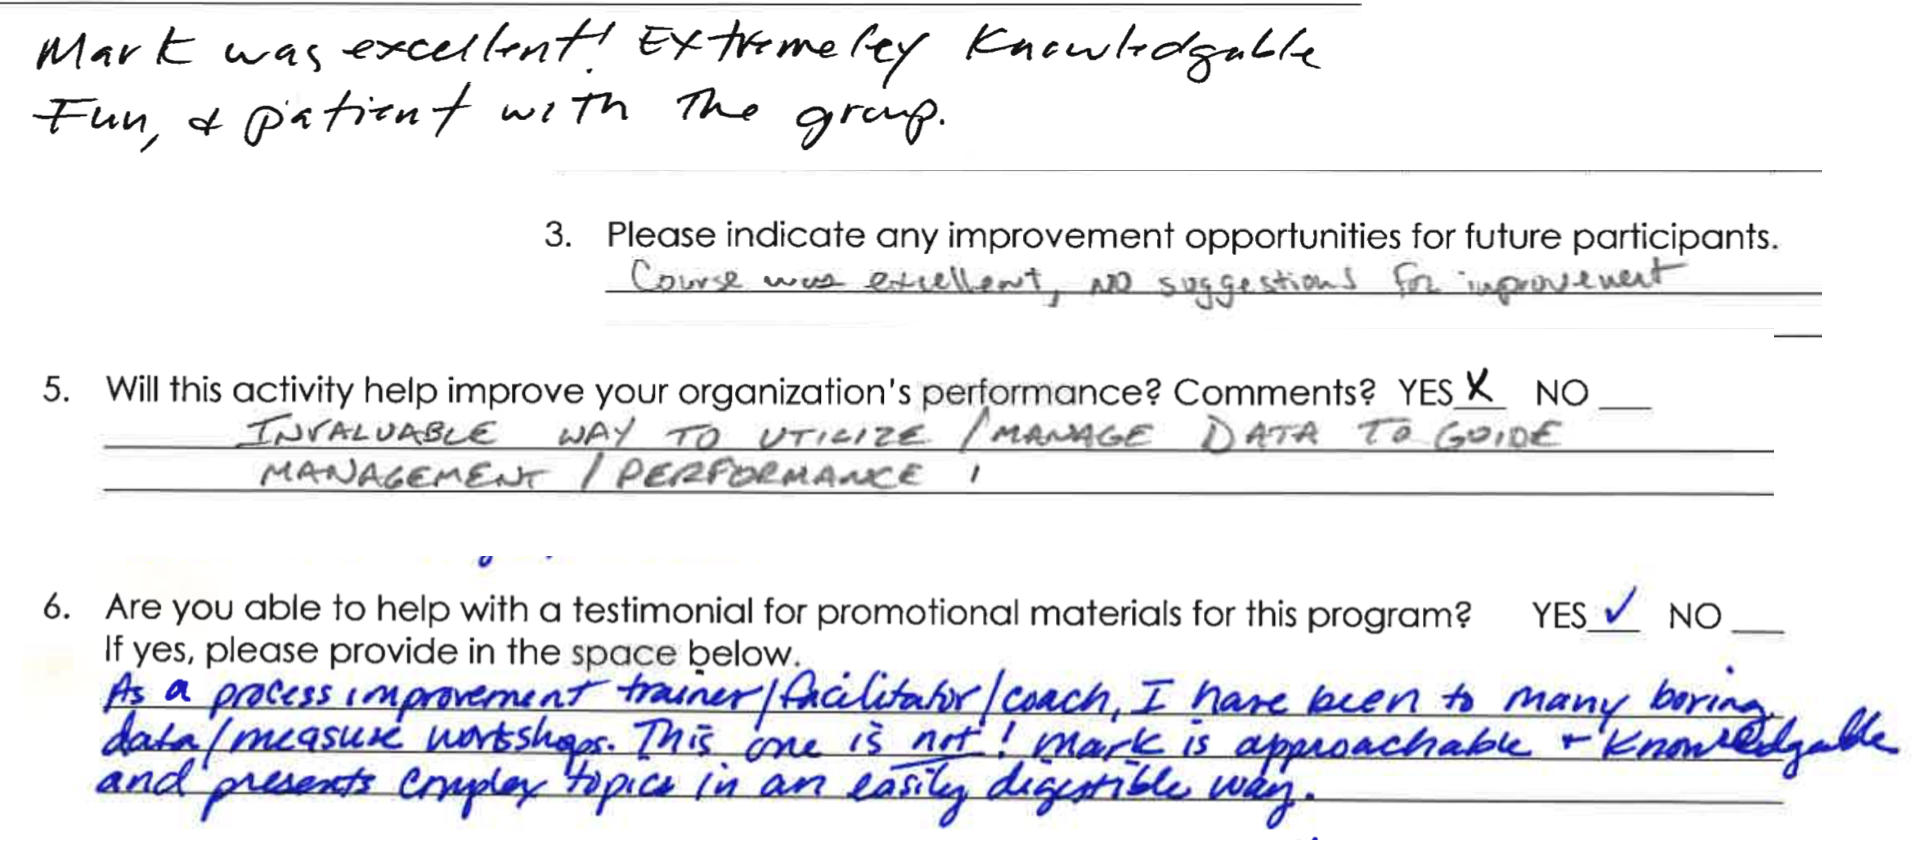
Participants said:
- “Great session and presenter. I’ve already started using what I learned and have been sharing with my team.”
- “Having us (the learners) create control charts was very effective.”
- “Made a dry subject (data) engaging. I wasn’t ready for the class to be over at the end of the day.”
- “Made numbers and metrics interesting for the entire 8 hours.”
- “Presented a very strong session.”
Feedback from June 2018:
- “Mark made complex ideas simple to understand”
- “It was great to hear Mark’s down to earth approach on process behavior charts.”
- “I thought Mark was outstanding!”
- “great flow, great info, well presented”
- “It was very informative.”
- “Easy to understand and kept the group involved.”
Feedback from June 2019:
Contact Mark:
If you’d like to talk about your challenges in this area through a free 30-minute phone call, please schedule time with Mark Graban.
Blog Posts:
Blog posts I have written about these concepts include:
Here is a webinar I gave on this topic:
Contact Mark Graban to learn more or to talk about bringing this workshop to your organization or